Debugging with OpellaXD
It is expected here that you have already built your application and created a debug configuration for it. Please refer to the following pages for more information:
Note
Opella-XD has some problems, see section Known issues.
On some platforms debugging fails when Opella-XD gdb server is started from the IDE, in this case use Alternative way of debugging.
Board Configuration
Board should be configured mostly the same way as for OpenOCD, see Board Configuration.
However, for AXS it is necessary to change some jumper settings when comparing to OpenOCD configuration. Please refer to AXS with Opella-XD board configuration.
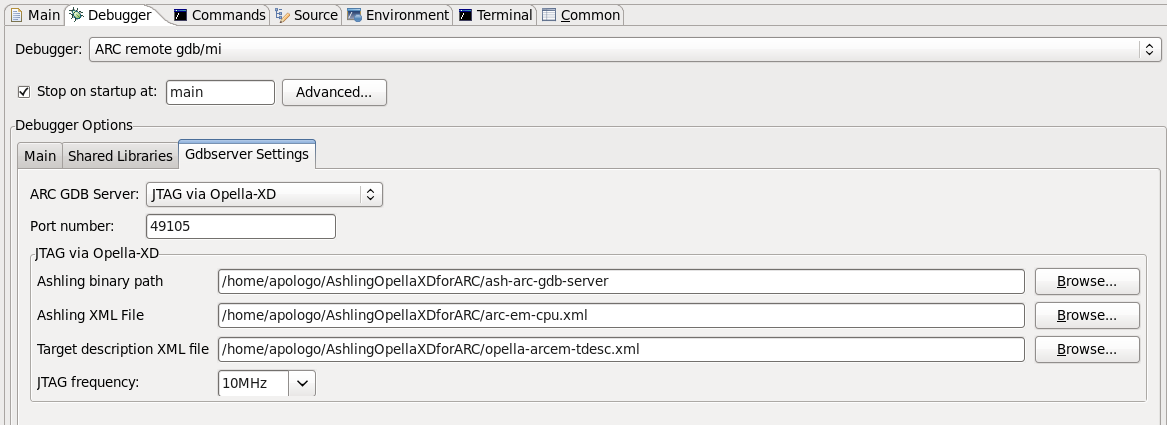
Specifying properties for Opella-XD
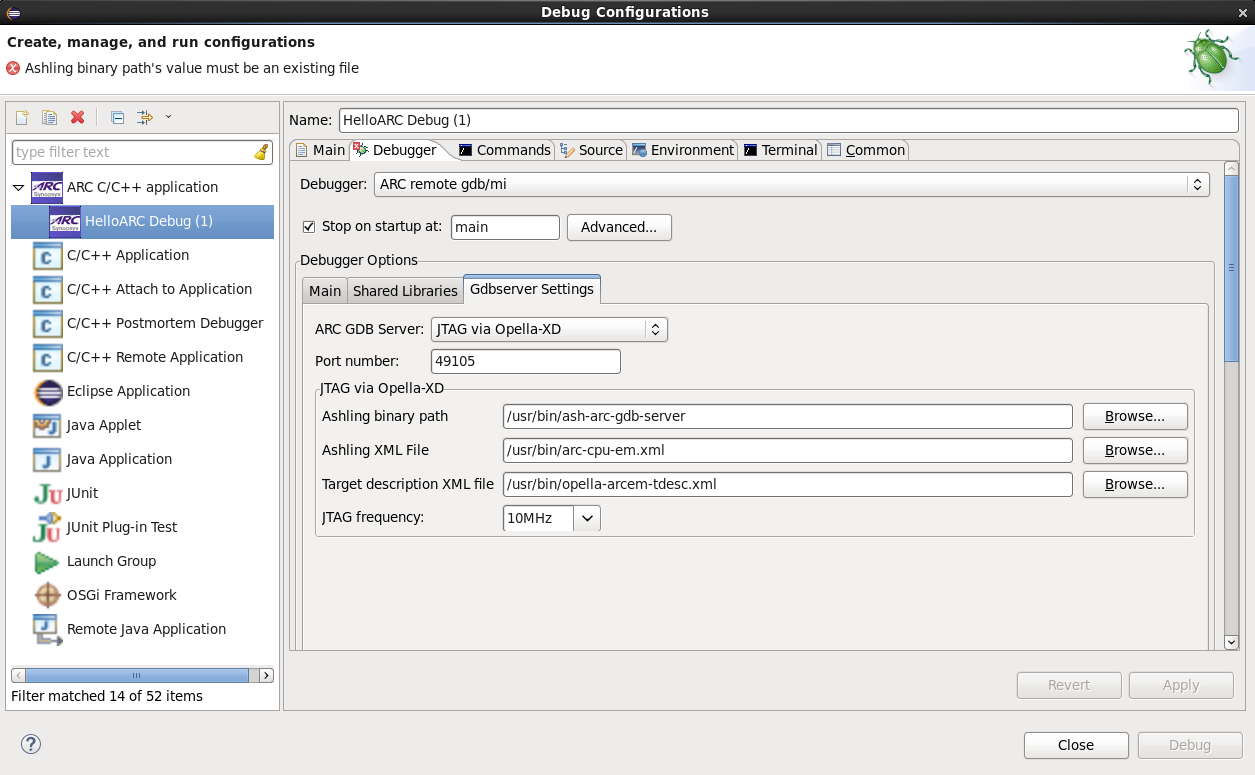
Opella-XD on debugger tab
In this tab you should specify paths to your ashling executable file and two XML
files. Both these files you can find here.
In the Ashling XML File field you should choose one of arc600-cpu.xml,
arc700-cpu.xml, arc-em-cpu.xml and arc-hs-cpu.xml. In the
Target description XML file should be path to opella-YOUR_CPU-tdesc.xml.
Note that file aux-minimal.xml should be also downloaded from that folder
and put into the same folder as opella-YOUR_CPU-tdesc.xml. This file
contains description common to all architectures and is included by all
“tdesc” files.
JTAG frequency should be set to 7 MHz for EM Starter Kit 2.0 and 2.1. For EM Starter Kit 2.2 select 5 MHZ. For other hardware development systems leave 10 MHz.
Note
Note that if you are using Opella-XD, you can not specify the core to debug, so you will be able to debug your application only if you have just one core in your JTAG chain.
Currently IDE always passes option --device arc to Opella-XD GDB-server
which means that server would be configured to work with TPAOP-ARC20-R0 cable. Server
configured in such way doesn’t work with TPAOP-ARC20-R1 - this cable requires
--device arc-jtag-tpa-r1 or --device arc-cjtag-tpa-r1 option to be
passed to Opella-XD GDB-server. As a consequence currently GNU IDE supports only
TPAOP-ARC20-R0 cable.
Warning
GDB on Windows can’t read XML files with Windows line endings (CR/LF) - tdesc XML file must be converted to UNIX line endings (LF).
Starting a debug session
To debug an application using Ashling Opella-XD, press Debug button of IDE and confirm switching to Debug Perspective.
Opella-XD properties
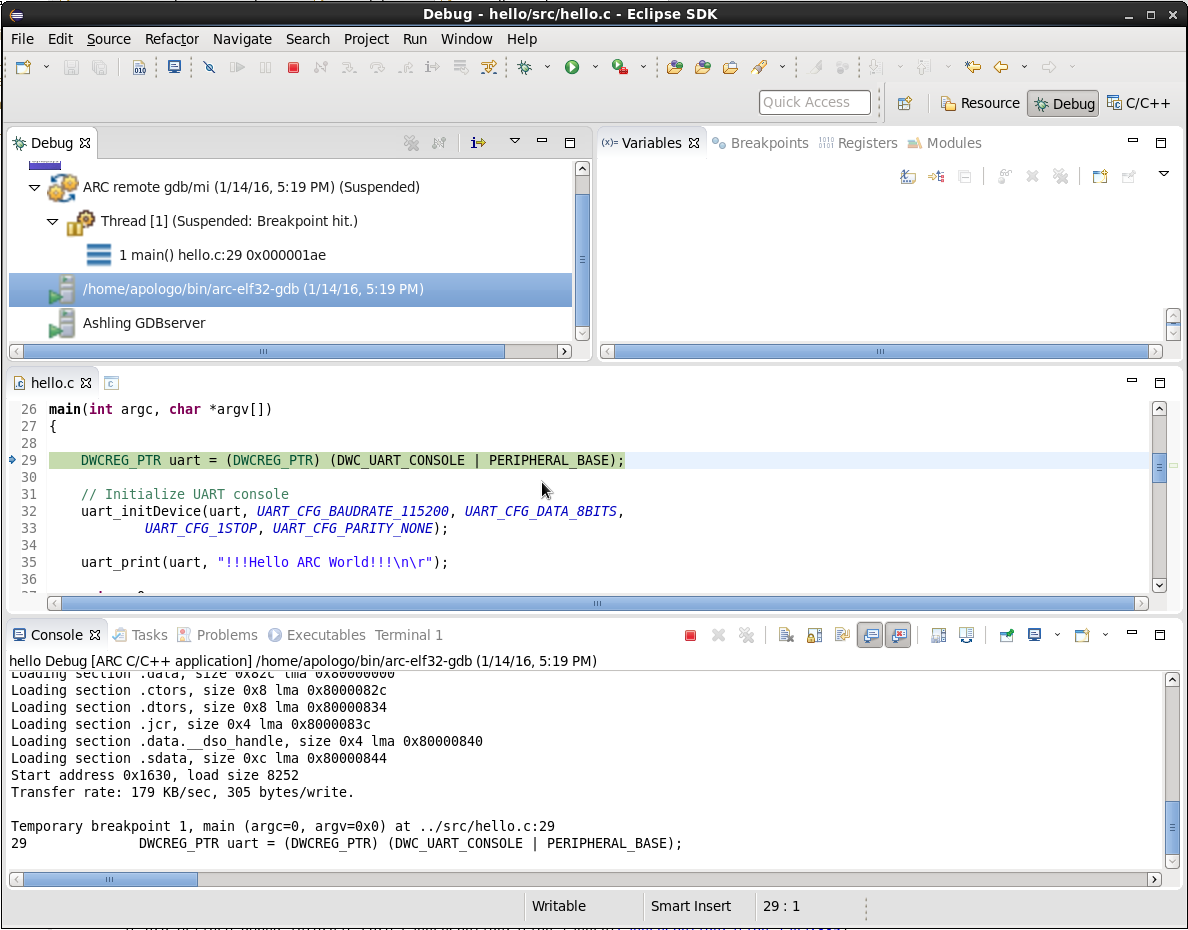
Debugging process with Opella-XD
Alternative way of debugging
Another way to debug an application is connecting to running gdb-server. Run Ashling GDB Server from command line as described in Running Ashling GDB Server. Choose the “Connect to running GDB server” value of ARC GDB Server field on Debugger tab of debug configuration.
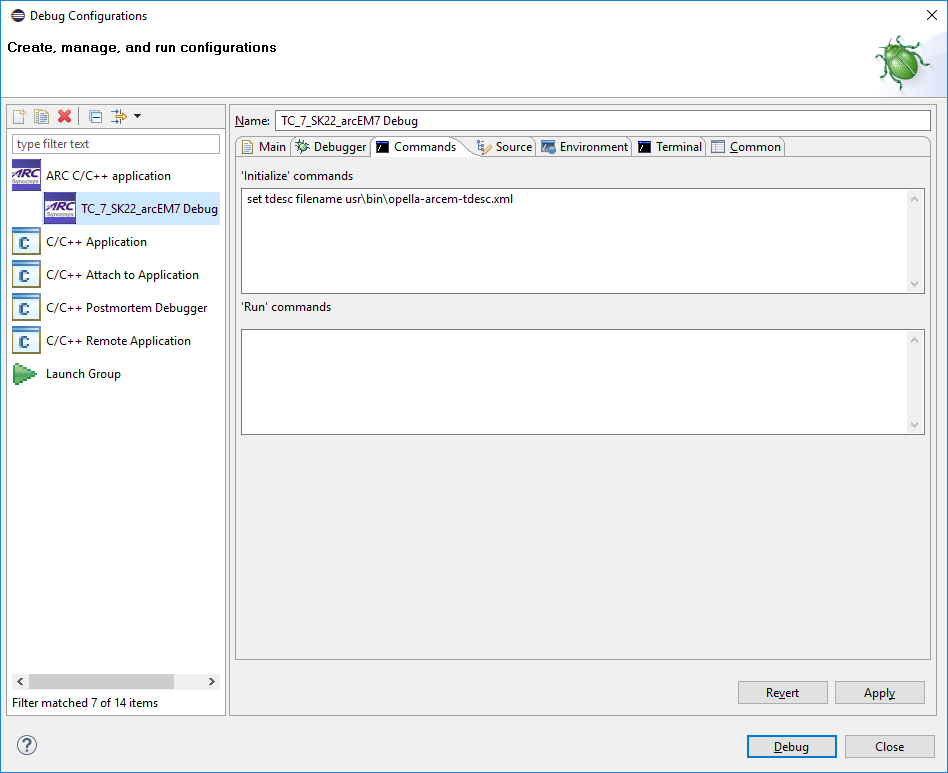
On the next tab, Commands, specify path to your tdesc file.
Start debug session after successful initialization of the gdb-server.