Creating a Debug Configuration
Creating a new debug configuration
Once the C Project is successfully compiled by ARC GCC, you can debug the resulting executable on a board or using nSIM.
To debug the project, create a new debug configuration.
1. Select Debug Configurations from the Run menu or by clicking on the down arrow next to the bug icon:
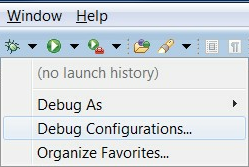
Debug Configurations
2. Double click on the ARC C/C++ Application or click on the top left icon to create a new debug configuration for the project:
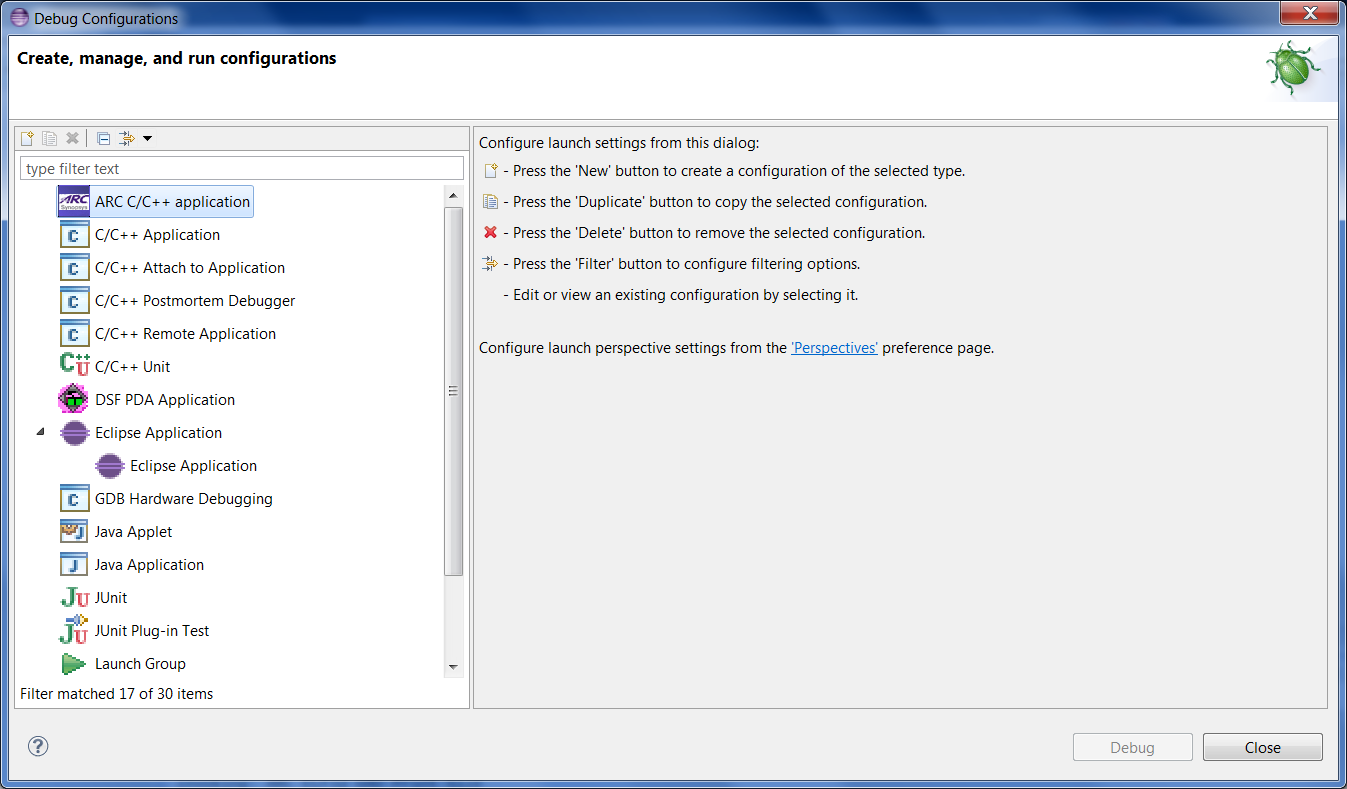
ARC Embedded Debug Configurations
3. Select a name for the new debug configuration (by default, it equals the project name followed by “Debug”).
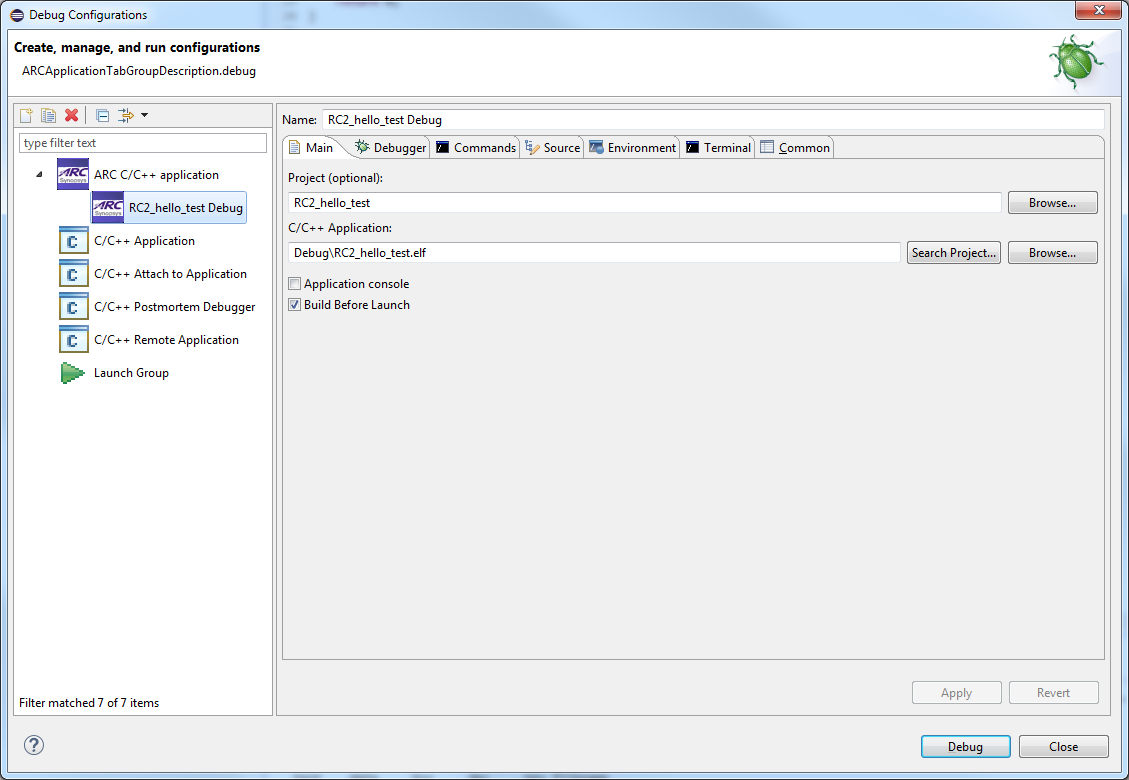
New debug Configuration
Click the Debugger tab.
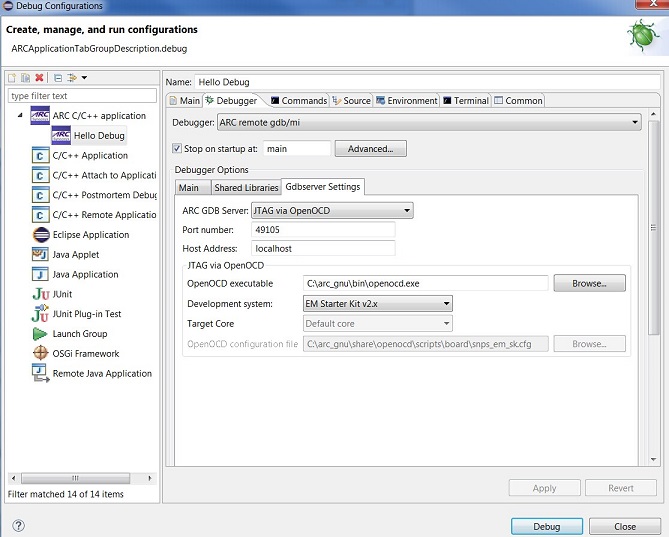
Default values in the Debugger tab for JTAG via OpenOCD
Here you can select a GDB server you want to use. About different GDB servers and their settings see pages
Debugging with OpenOCD <debugging-with-openocd>
Debugging with Opella-XD <debugging-with-opellaxd>
Debugging with nSIM <debugging-with-nsim>
Debugging using custom GDB server <debugging-with-custom-gdb-server>
Using running GDB server <debugging-with-running-gdb-server>
Note
There is a known problem with changing ARC GDB Server’s value on Ubuntu. After changing the value there are only two fields visible: ARC GDB Server and Port number. Workaround: select GDB server’s value, press Apply button, then close and open the dialog again. After that all the necessary fields become visible.
Setting a COM port
If you are debugging an application on a board you need to specify a COM port to connect to. Open the Terminal tab.
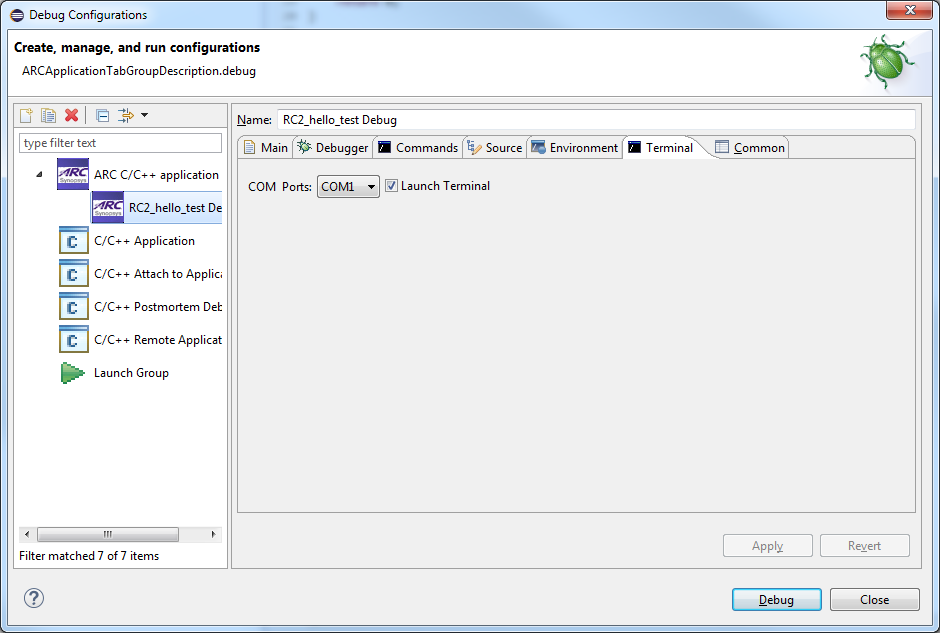
Terminal Tab
The COM Ports picklist shows the value for Digilent USB Serial Port from the Windows registry. You can modify the value as desired, but the selection must match the port number in Device and Printers as shown in below.
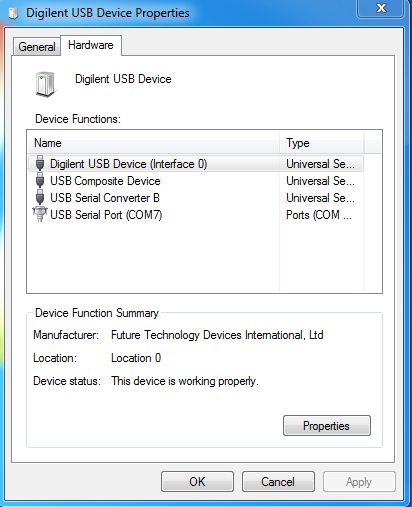
Digilent USB Serial COM Port
Starting a debug session
Click the Debug button in the Debug configurations dialog or Debug button of IDE to initiate debug session.
This action automatically launches your GDB server (if you are not connecting to a running one). If you are using a board, it also launches the Serial terminal and connects to your board.
Click Yes in the confirmation dialog to switch to the Debug perspective.