Using Debug Perspective
The Debug perspective provides an integrated debug environment with individual windows to display various debugging data such as the debug stack, variables, registers breakpoints, etc.
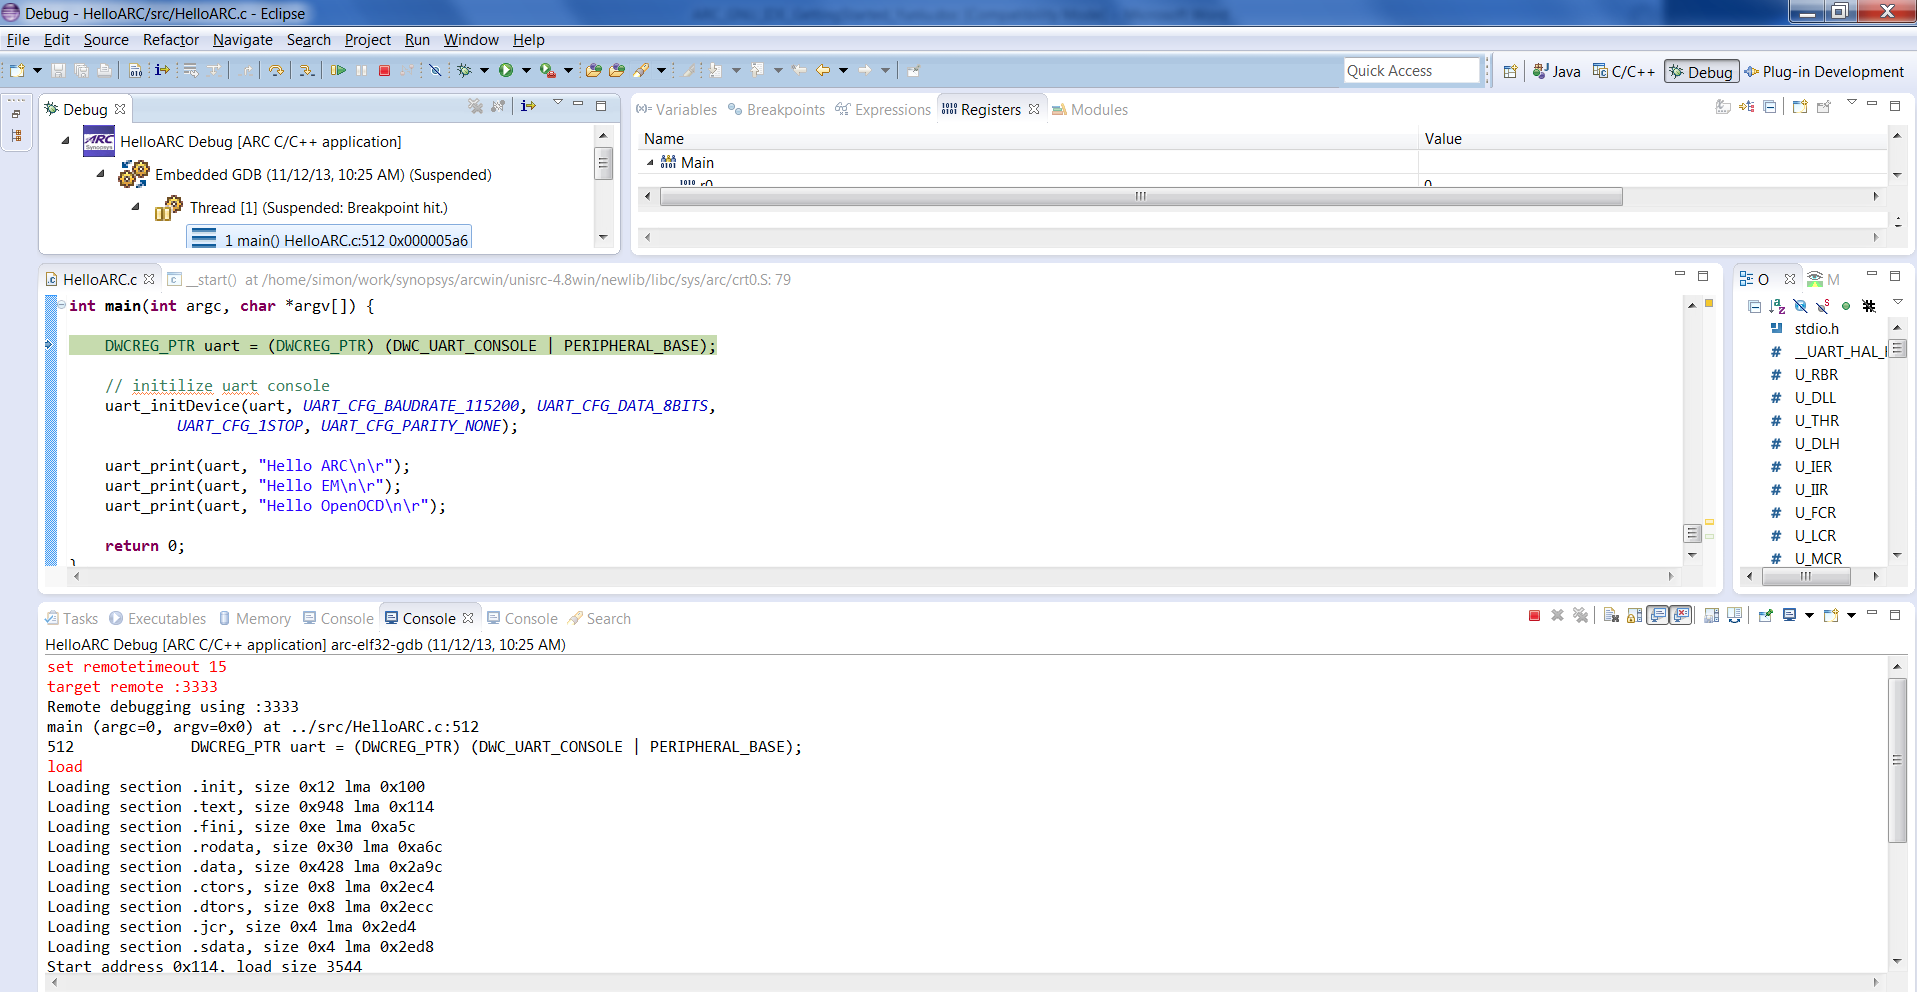
Debug Perspective
To set a breakpoint, place your cursor on the marker bar along the left edge of the editor window on the line where you want the breakpoint:
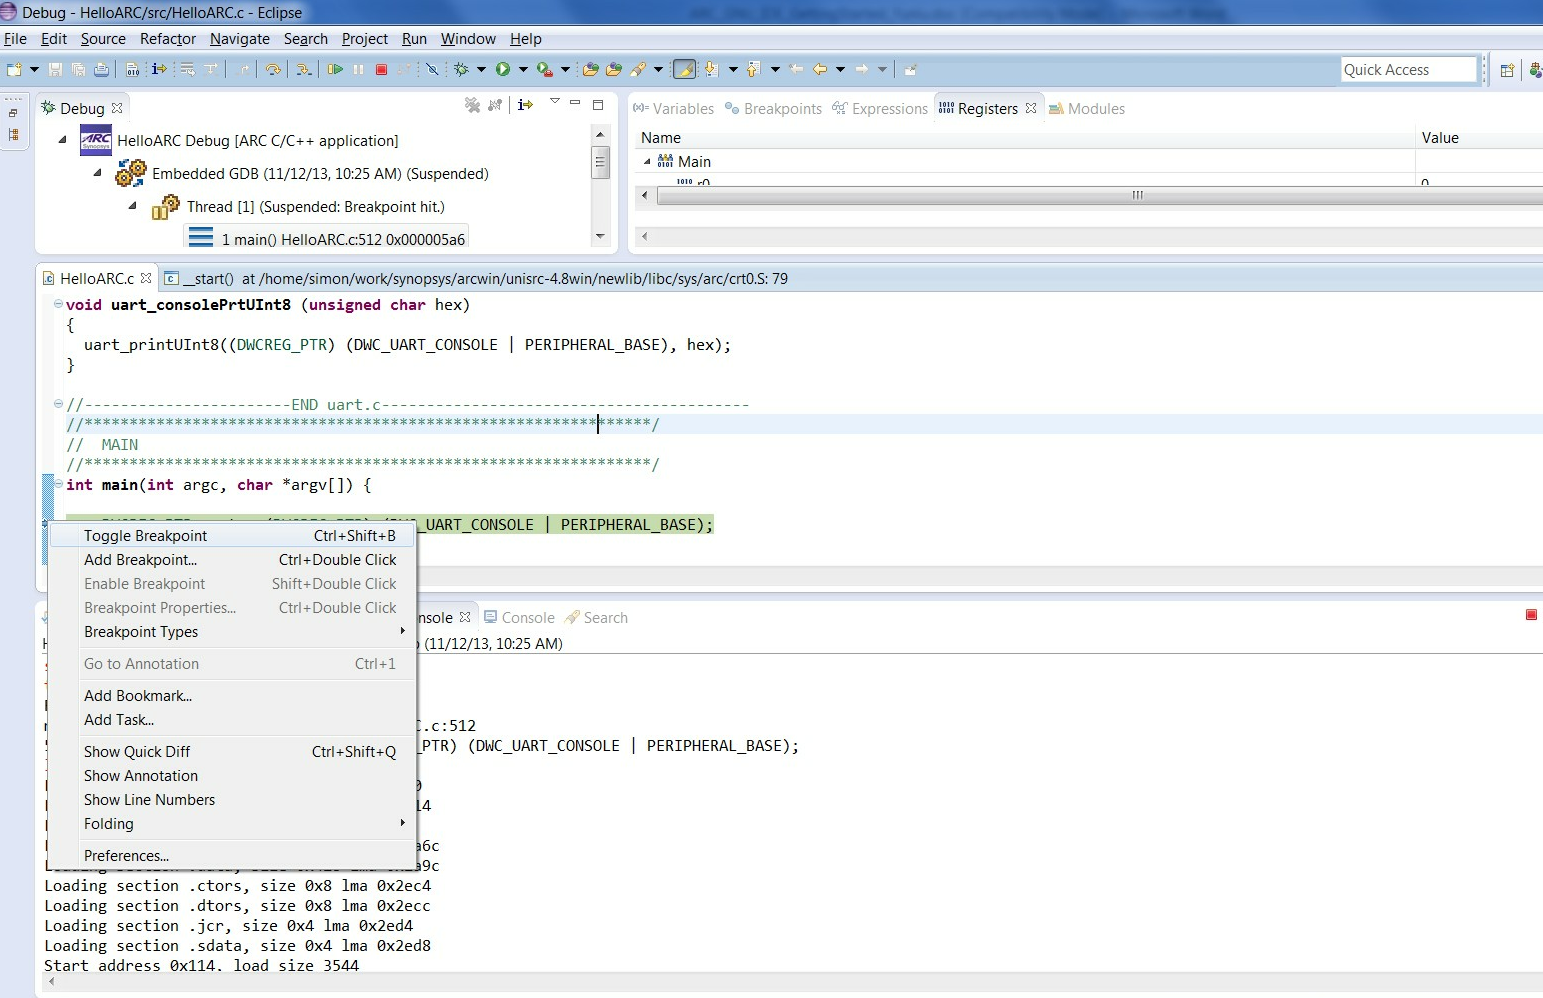
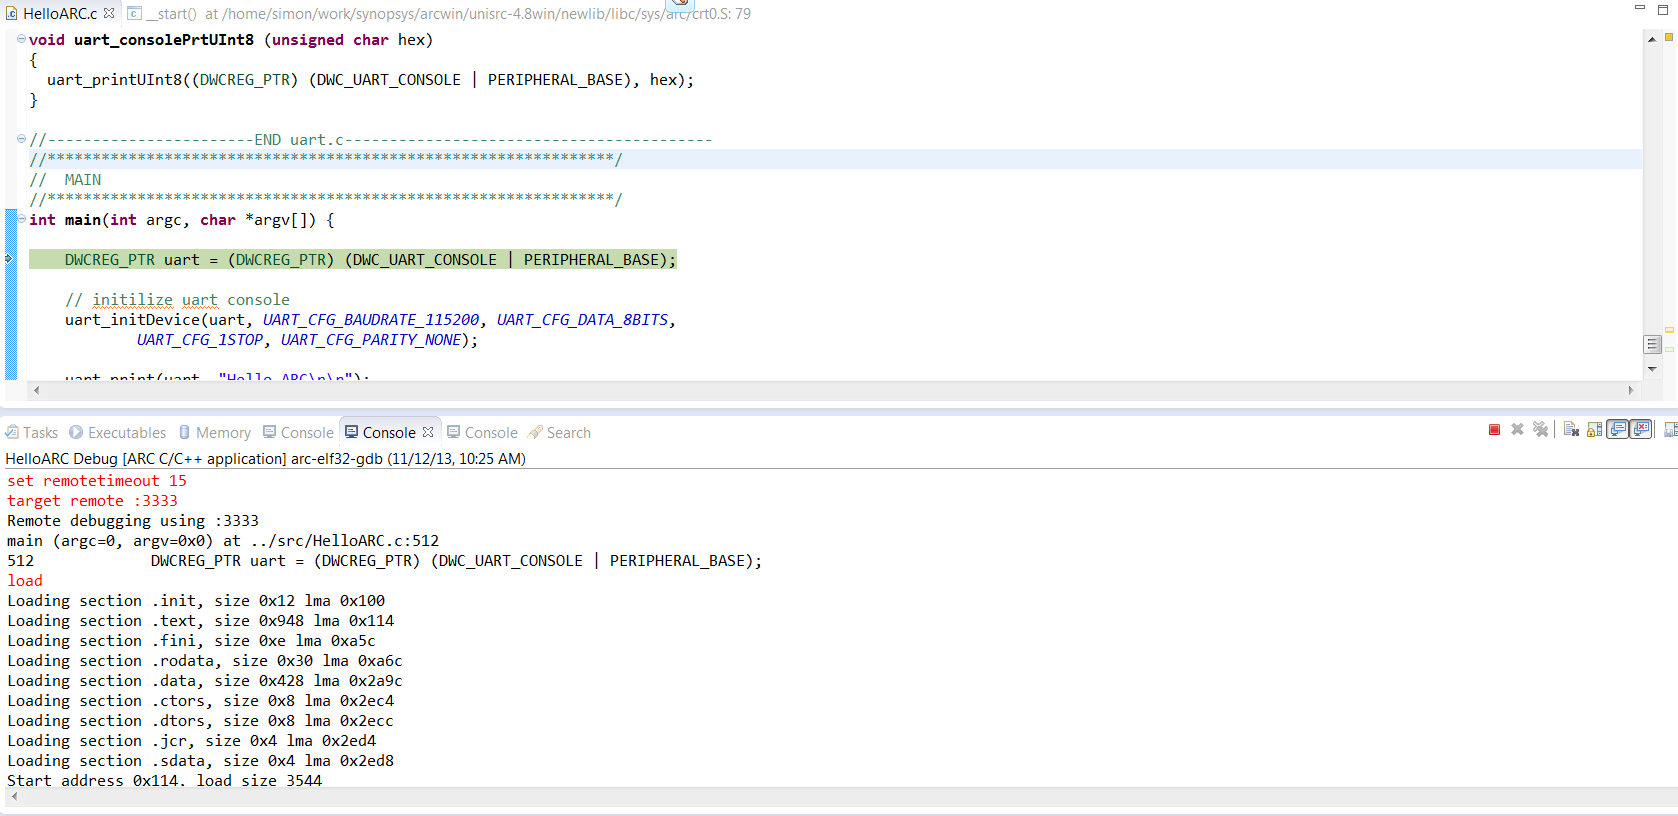
Source File Window in Debug Perspective with Breakpoint Set
Examine Variables, Breakpoints, Expressions or Registers from different tabs of the same debug perspective:
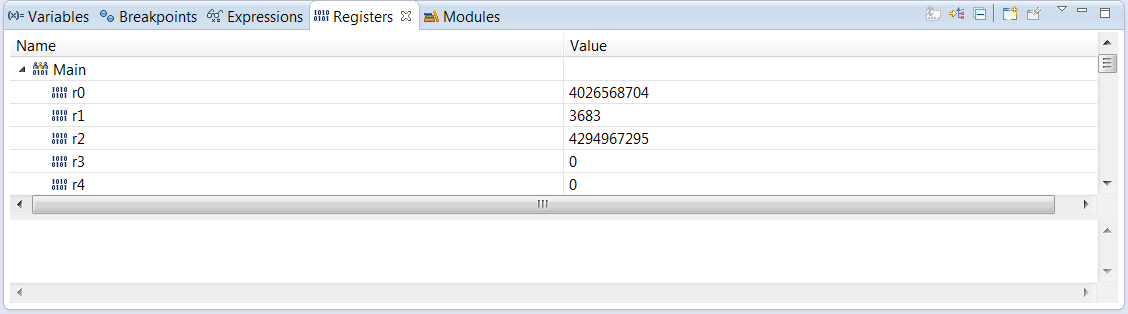
Registers Window in Debug Perspective
Examine the debug Views showing the debugger in use:
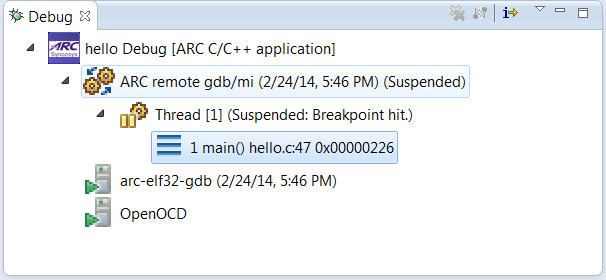
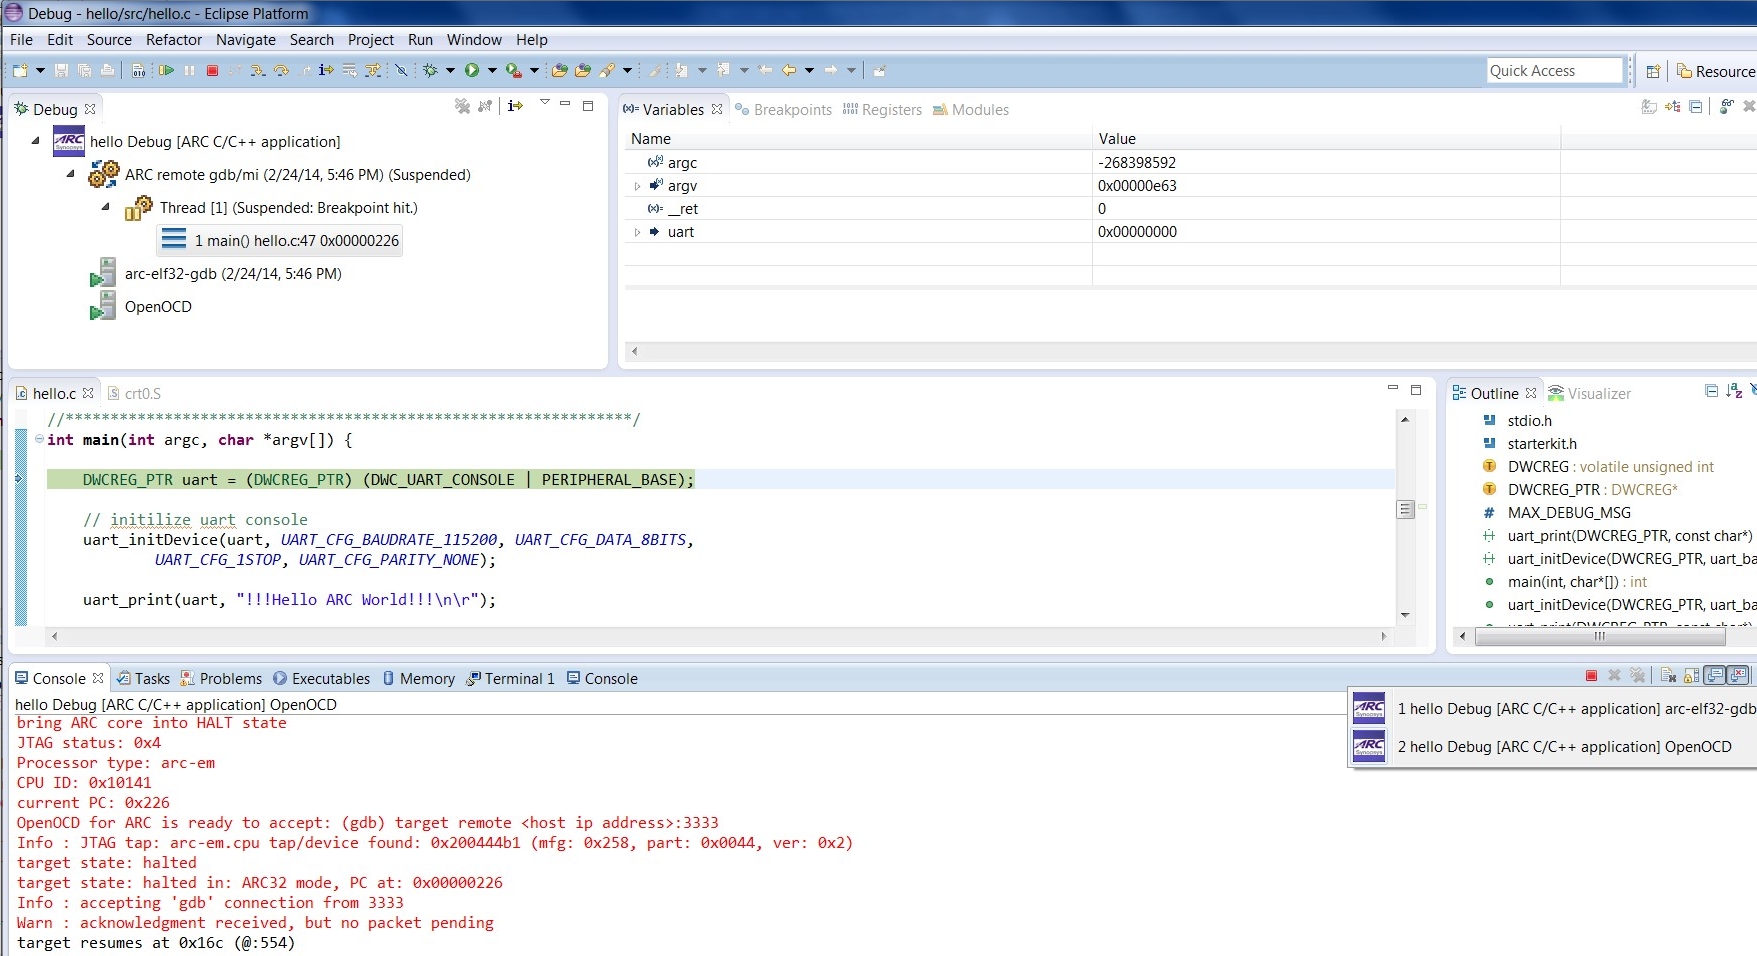
Debug Window in Debug Perspective
Hello ARC Debug Console in Debug Perspective
Switch Console tabs to view OpenOCD Console output:
Multiple Consoles in the Debug Perspective
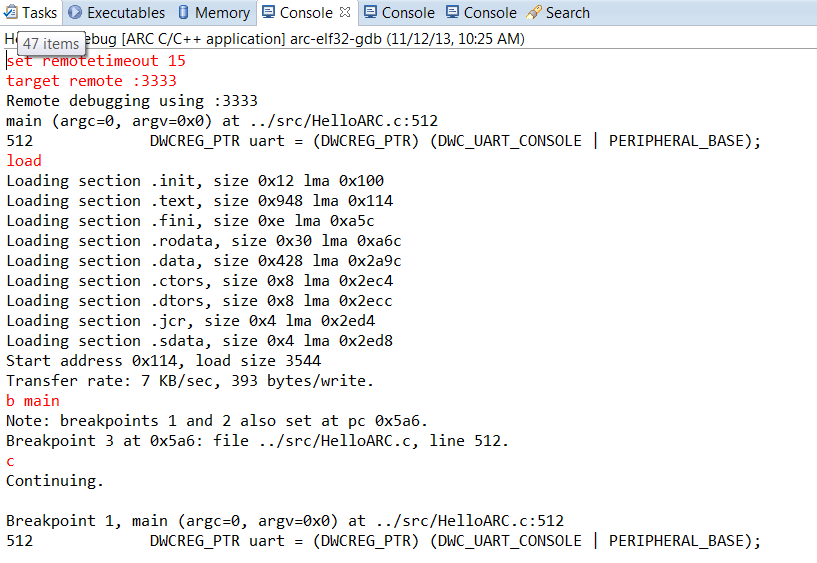
Hello ARC Debug Console Output
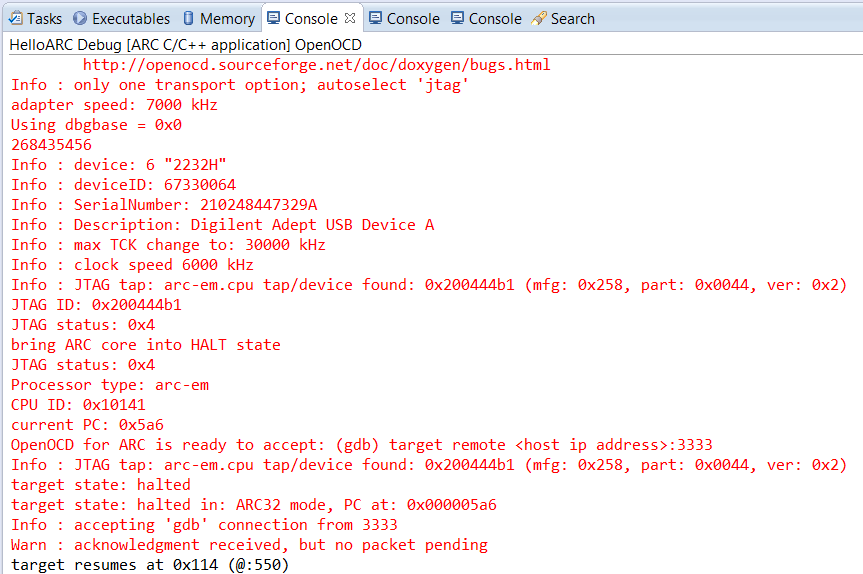
OpenOCD Console Output
Step through each line by using F5 (step into), and F6 (step over).

Stepping Toolbar
Toggle breakpoint at the last line of main(), which is “}” , and then click Resume or press F8.
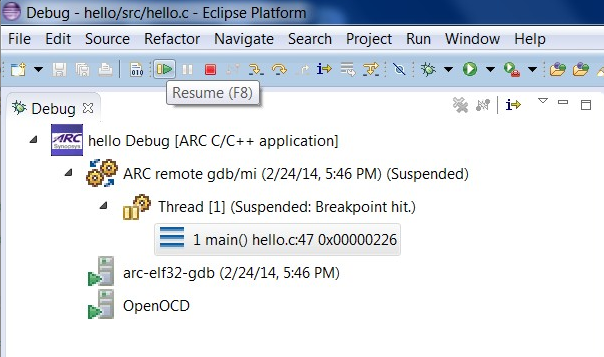
Click Resume or Press F8
To see the UART output, open Eclipse Terminal view.
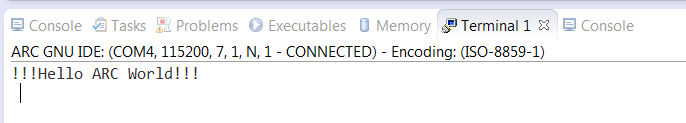
Final Output Printed to Serial Terminal Window through UART
You will be able to see the output in the Terminal view only if COM port specified in Terminal tab of Debug Configurations dialog is right. Read more about specifying a COM port Setting a COM port
Terminate all external tools before you quit current debugging process.
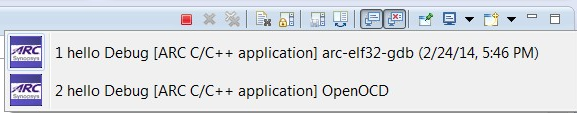
Consoles for child processes